
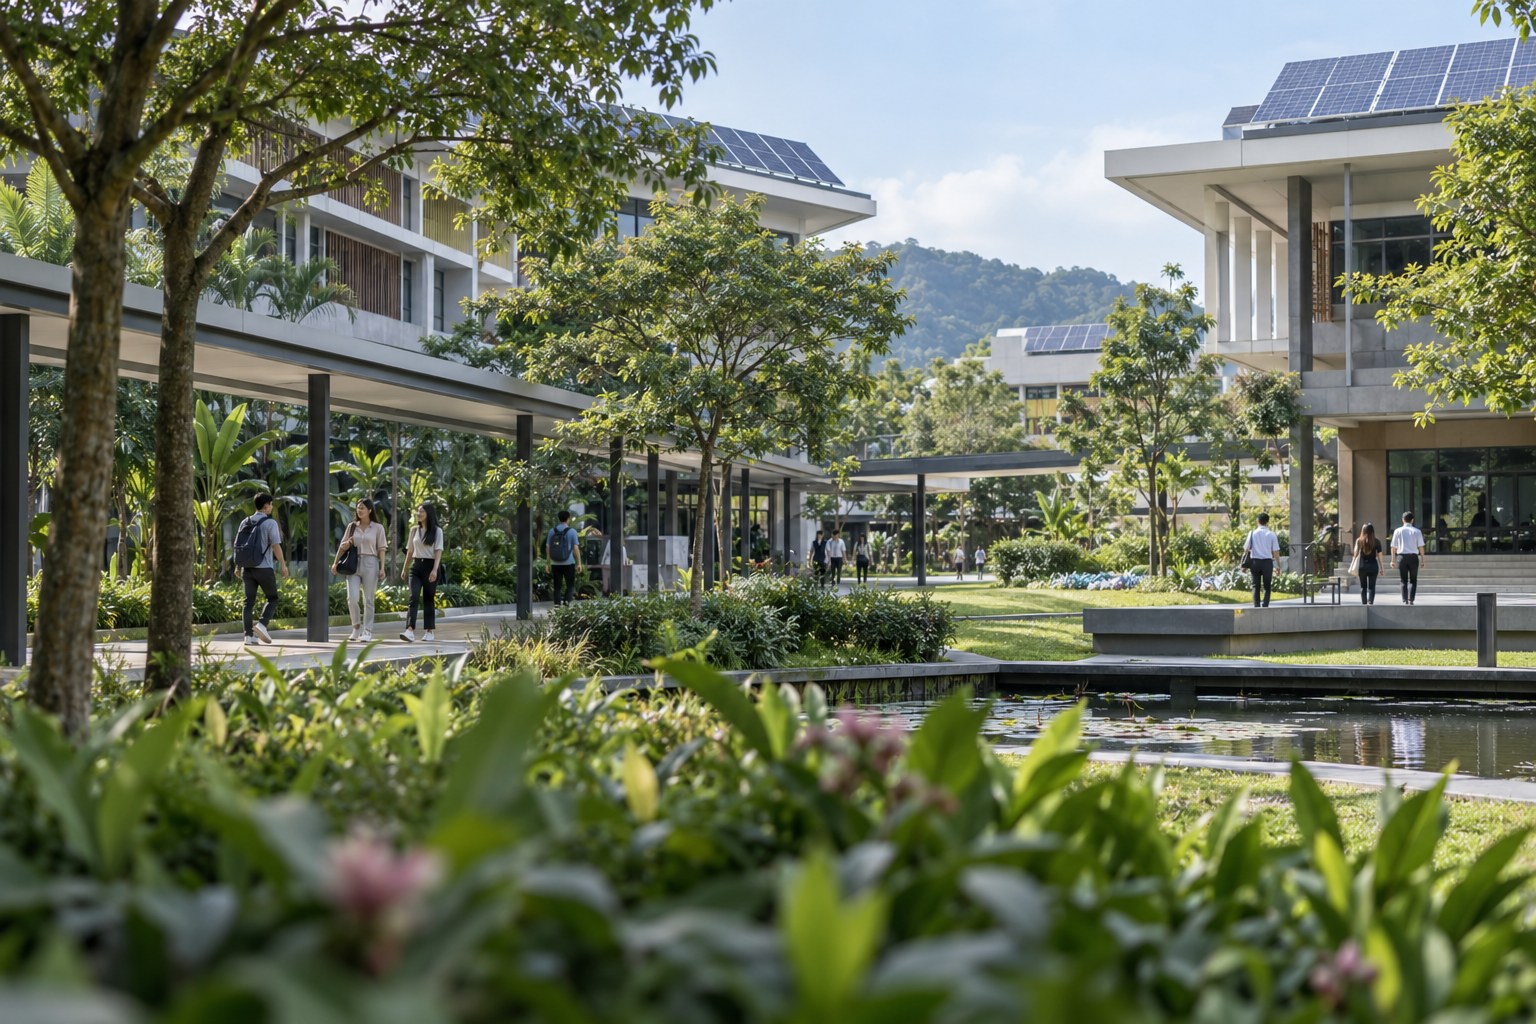
A university in Southeast Asia publishes a campus sustainability page. It lists a ranking position, a diamond rating from a national low-carbon scheme, a solar installation, a recycling programme and a percentage reduction in emissions. Every item is real. Yet if a prospective postgraduate student, a corporate partner or a journalist asked which years the percentage compares, what was inside the measurement boundary and who verified it, the answer would take several days and three departments to assemble.
That gap between activity and evidence is now the central problem in campus sustainability across Asia. The region is no longer a marginal participant in this field. Asian institutions submitted more data to global sustainability assessments in recent cycles than any other region, and the reporting burden has grown faster than the internal systems built to carry it.
Asia is no longer following this agenda. It is setting the pace
The scale of participation is easy to underestimate. The UI GreenMetric ranking, launched by Universitas Indonesia in 2010, began with 95 universities from 35 countries and now assesses 1,745 institutions across 105 countries. Its 2025 edition included 196 Indonesian and 91 Malaysian universities, while several large Western systems were represented by only a handful of institutions.
The picture is similar elsewhere. The 2025 Times Higher Education Impact Rankings ranked 2,526 universities from 130 countries, with more than 2,500 submitting data in total. Asian institutions accounted for over half of all ranked places and led ten of the seventeen individual Sustainable Development Goal tables, and Asian submissions rose by roughly a quarter in a single year. Universitas Airlangga of Indonesia placed joint ninth overall, the strongest result from an emerging economy.
National frameworks add another layer. Malaysia’s Low Carbon City 2030 Challenge, run by the Malaysian Green Technology and Climate Change Corporation since 2019, has drawn campuses into structured emissions reporting alongside municipalities. Universiti Malaysia Pahang Al-Sultan Abdullah reported a greenhouse gas reduction of 36.89 per cent against a 2019 baseline under the scheme’s 2025 assessment. That figure is readable precisely because the baseline year is stated. Most public sustainability percentages are not.
What each form of recognition actually proves
Institutions often treat rankings, certifications, national schemes and records as interchangeable proof points and place them side by side on the same web page. They answer different questions, and mixing them invites the suspicion that none of them is being understood.
| Form of recognition | What it mainly evidences | What it does not establish |
|---|---|---|
| Global sustainability rankings | Relative standing against other participating institutions on a fixed indicator set | Absolute environmental performance, or comparability where national participation is uneven |
| National low-carbon schemes | Measured progress against a declared baseline within a defined boundary | Performance outside the scheme’s scope, or comparison across countries |
| Environmental management system certification | That documented processes exist and are being followed and audited | That outcomes have improved, or by how much |
| Independent record recognition | That one specific, measurable achievement occurred as described | Ongoing performance, regulatory compliance or system-wide quality |
| Institutional sustainability report | What the institution says about itself, in its own chosen framing | Anything independently checked, unless assurance is stated |
A sustainability page that explains which of these it is presenting, and why, is more persuasive than one that presents five logos without distinction.
The five-part test for any campus sustainability claim
Before a number leaves the estates office, five questions should have written answers. The discipline matters more than the sophistication.
- Boundary. What is inside the measurement, and what is outside it? A single flagship campus, or every site including leased premises and branch campuses? Boundary changes are the most common reason a figure improves without anything improving.
- Baseline. Against what year, and was that year normal? Baselines drawn from a period of reduced campus occupancy will flatter any later comparison, and readers who notice will discount everything else on the page.
- Basis. Is this measured, metered, modelled or estimated? Electricity drawn from a meter and commuting emissions derived from a survey are not the same class of evidence and should not be printed in the same typeface without a note.
- Verification. Who outside the team that produced the number has examined it? Internal audit, an assurance provider, a ranking’s evidence upload requirement and a formal verification process all count. Nothing counts silently.
- Beneficiary. Who is better off, and how would they know? A campus that cut consumption while enrolment fell has not necessarily improved anything a student experiences.
Scope discipline deserves particular attention. Direct emissions and purchased energy are comparatively tractable. The indirect category covering procurement, travel and supply chains is far harder, because it depends on suppliers reporting their own data back to the institution. Rapidly expanding campuses with long vendor lists face this acutely, and it is better to state that the category is partially reported than to omit it and let readers assume it was included.
Five mistakes that undermine genuinely good work
- Percentages without a baseline year. The single most common failure, and the easiest to fix.
- Retiring inconvenient indicators. Dropping a metric that moved in the wrong direction is noticed by anyone comparing two years of reports.
- Counting inputs as outcomes. Bins installed, panels commissioned and policies signed are commitments. Waste diverted and energy generated are results.
- One-off events presented as ongoing performance. A single planting day is a genuine achievement and should be described as one, not as a programme.
- No named owner. If no individual is accountable for each published figure, the institution cannot answer a follow-up question at the speed a journalist works.
When a campus milestone is a record rather than a trend
Rankings and certification schemes are built for continuous performance. They handle annual averages well and exceptional single events poorly. Campus environmental programmes, though, generate exactly those exceptional events: the largest simultaneous planting activity a state has hosted, a mass clean-up involving every faculty on a single morning, a collection or installation milestone that nothing in the sector matches.
These sit awkwardly in a sustainability report and disappear entirely from a ranking submission. Where such a milestone is specific, measured under stated conditions and supported by contemporaneous evidence, independent record recognition offers a route to document it properly. Asia Record assesses and verifies measurable achievements submitted by individuals, businesses and institutions across Asia, and maintains a public directory of recognised record holders, with categories that include company records and mass participation records. Several hundred record holders are currently listed.
Two cautions matter. Record recognition documents one achievement; it is not a substitute for accreditation, environmental management certification or any regulatory reporting obligation, and no institution should present it as one. And the evidence question arrives before the application does. Counts must be independently observed at the time, conditions recorded, and the measurement method fixed in advance rather than reconstructed afterwards. Institutions considering how to get an Asia Record for a campus milestone generally find the preparation work more demanding than the submission. Those with a milestone already documented to that standard can apply for Asia Record recognition directly.
A workable sequence for the next twelve months
- Inventory every published claim. Pull every sustainability figure currently on the website, in the prospectus and in ranking submissions into one document. Institutions are routinely surprised by contradictions between them.
- Fix the boundary and baseline once. Agree both across the whole institution before the next reporting cycle, and record the decision. Every later figure inherits it.
- Grade the evidence. Mark each figure as metered, surveyed, modelled or estimated, and publish that grading. It is a mark of competence, not a weakness.
- Assign named owners. One person per figure, with the source file reachable within an hour.
- Separate the exceptional from the ongoing. Route continuing performance into rankings and national schemes, and treat one-off milestones as candidates for record documentation while the evidence still exists.
The institutions that hold up best under scrutiny are rarely those with the most impressive numbers. They are the ones that can explain, without preparation, what was counted, when, against what, and who else has looked at it. In a region now supplying the majority of the world’s sustainability submissions in higher education, that capability is becoming the difference between a campus that is trusted and one that is merely loud.